Urban Heat Islands & GIS: Gothenburg's Climate Adaptation Strategies
This is the final thesis from my two years studying to become a GIS-Coordinator. The thesis investigates Gothenburg’s efforts to address climate-related heat challenges, focusing on the Urban Heat Island phenomenon using GIS and satellite data.
Summary
The thesis investigates how Gothenburg addresses climate-related heat challenges, focusing on urban heat islands through the use of GIS and satellite data analysis. By analyzing land surface temperatures using satellite data and Google Earth Engine, particularly vulnerable areas in the city were identified, mainly the central and densely built-up areas with low vegetation, where surface temperatures can exceed +40°C during the summer months. The study also reveals that areas with more vegetation and water bodies have lower temperatures, highlighting the importance of green and blue infrastructure to mitigate the effects of urban heat islands.
Gothenburg has implemented strategies to address these challenges, including the expansion of parks, tree planting, and water areas, in line with the city's environmental and climate program as well as the climate adaptation plan for 2024–2026. The results of the GIS analysis confirm that these strategies are effective in reducing temperatures in the urban environment. GIS plays a central role in monitoring heat phenomena and providing decision-makers with the tools to take appropriate action. A remaining challenge is to communicate the results clearly and accessibly to both the public and decision-makers, which is crucial for integrating the analyses into urban planning.
This project was my final exam after two years of studying to become a GIS-Coordinator through Ocellus Information Systems. If you want to read the full report follow the link below:
Urbana Värmeöar & GIS: Göteborgs strategier för att hantera klimatrelaterade värmeutmaningarLand cover
To classify and gain an overview of the land surfaces contributing to temperature changes, the National Land Cover Data from the Swedish Environmental Protection Agency has been utilized. Building polygons are sourced from the base map of Gothenburg city and are classified as impervious surfaces, primarily for visualization purposes. The study partly follows the methodology and practical application described in the Swedish Public Health Agency's report, Kartläggning av bebyggelse med risk för höga temperaturer
The land cover data has been vectorized to calculate the proportion of different surface types.
Surface Types and Coverage
Impervious Surfaces: 11.09%
High Vegetation: 18.73%
Low Vegetation: 13.87%
Open Water Surfaces: 56.30%
Surface Types and Coverage
Impervious Surfaces: 11.09%
High Vegetation: 18.73%
Low Vegetation: 13.87%
Open Water Surfaces: 56.30%
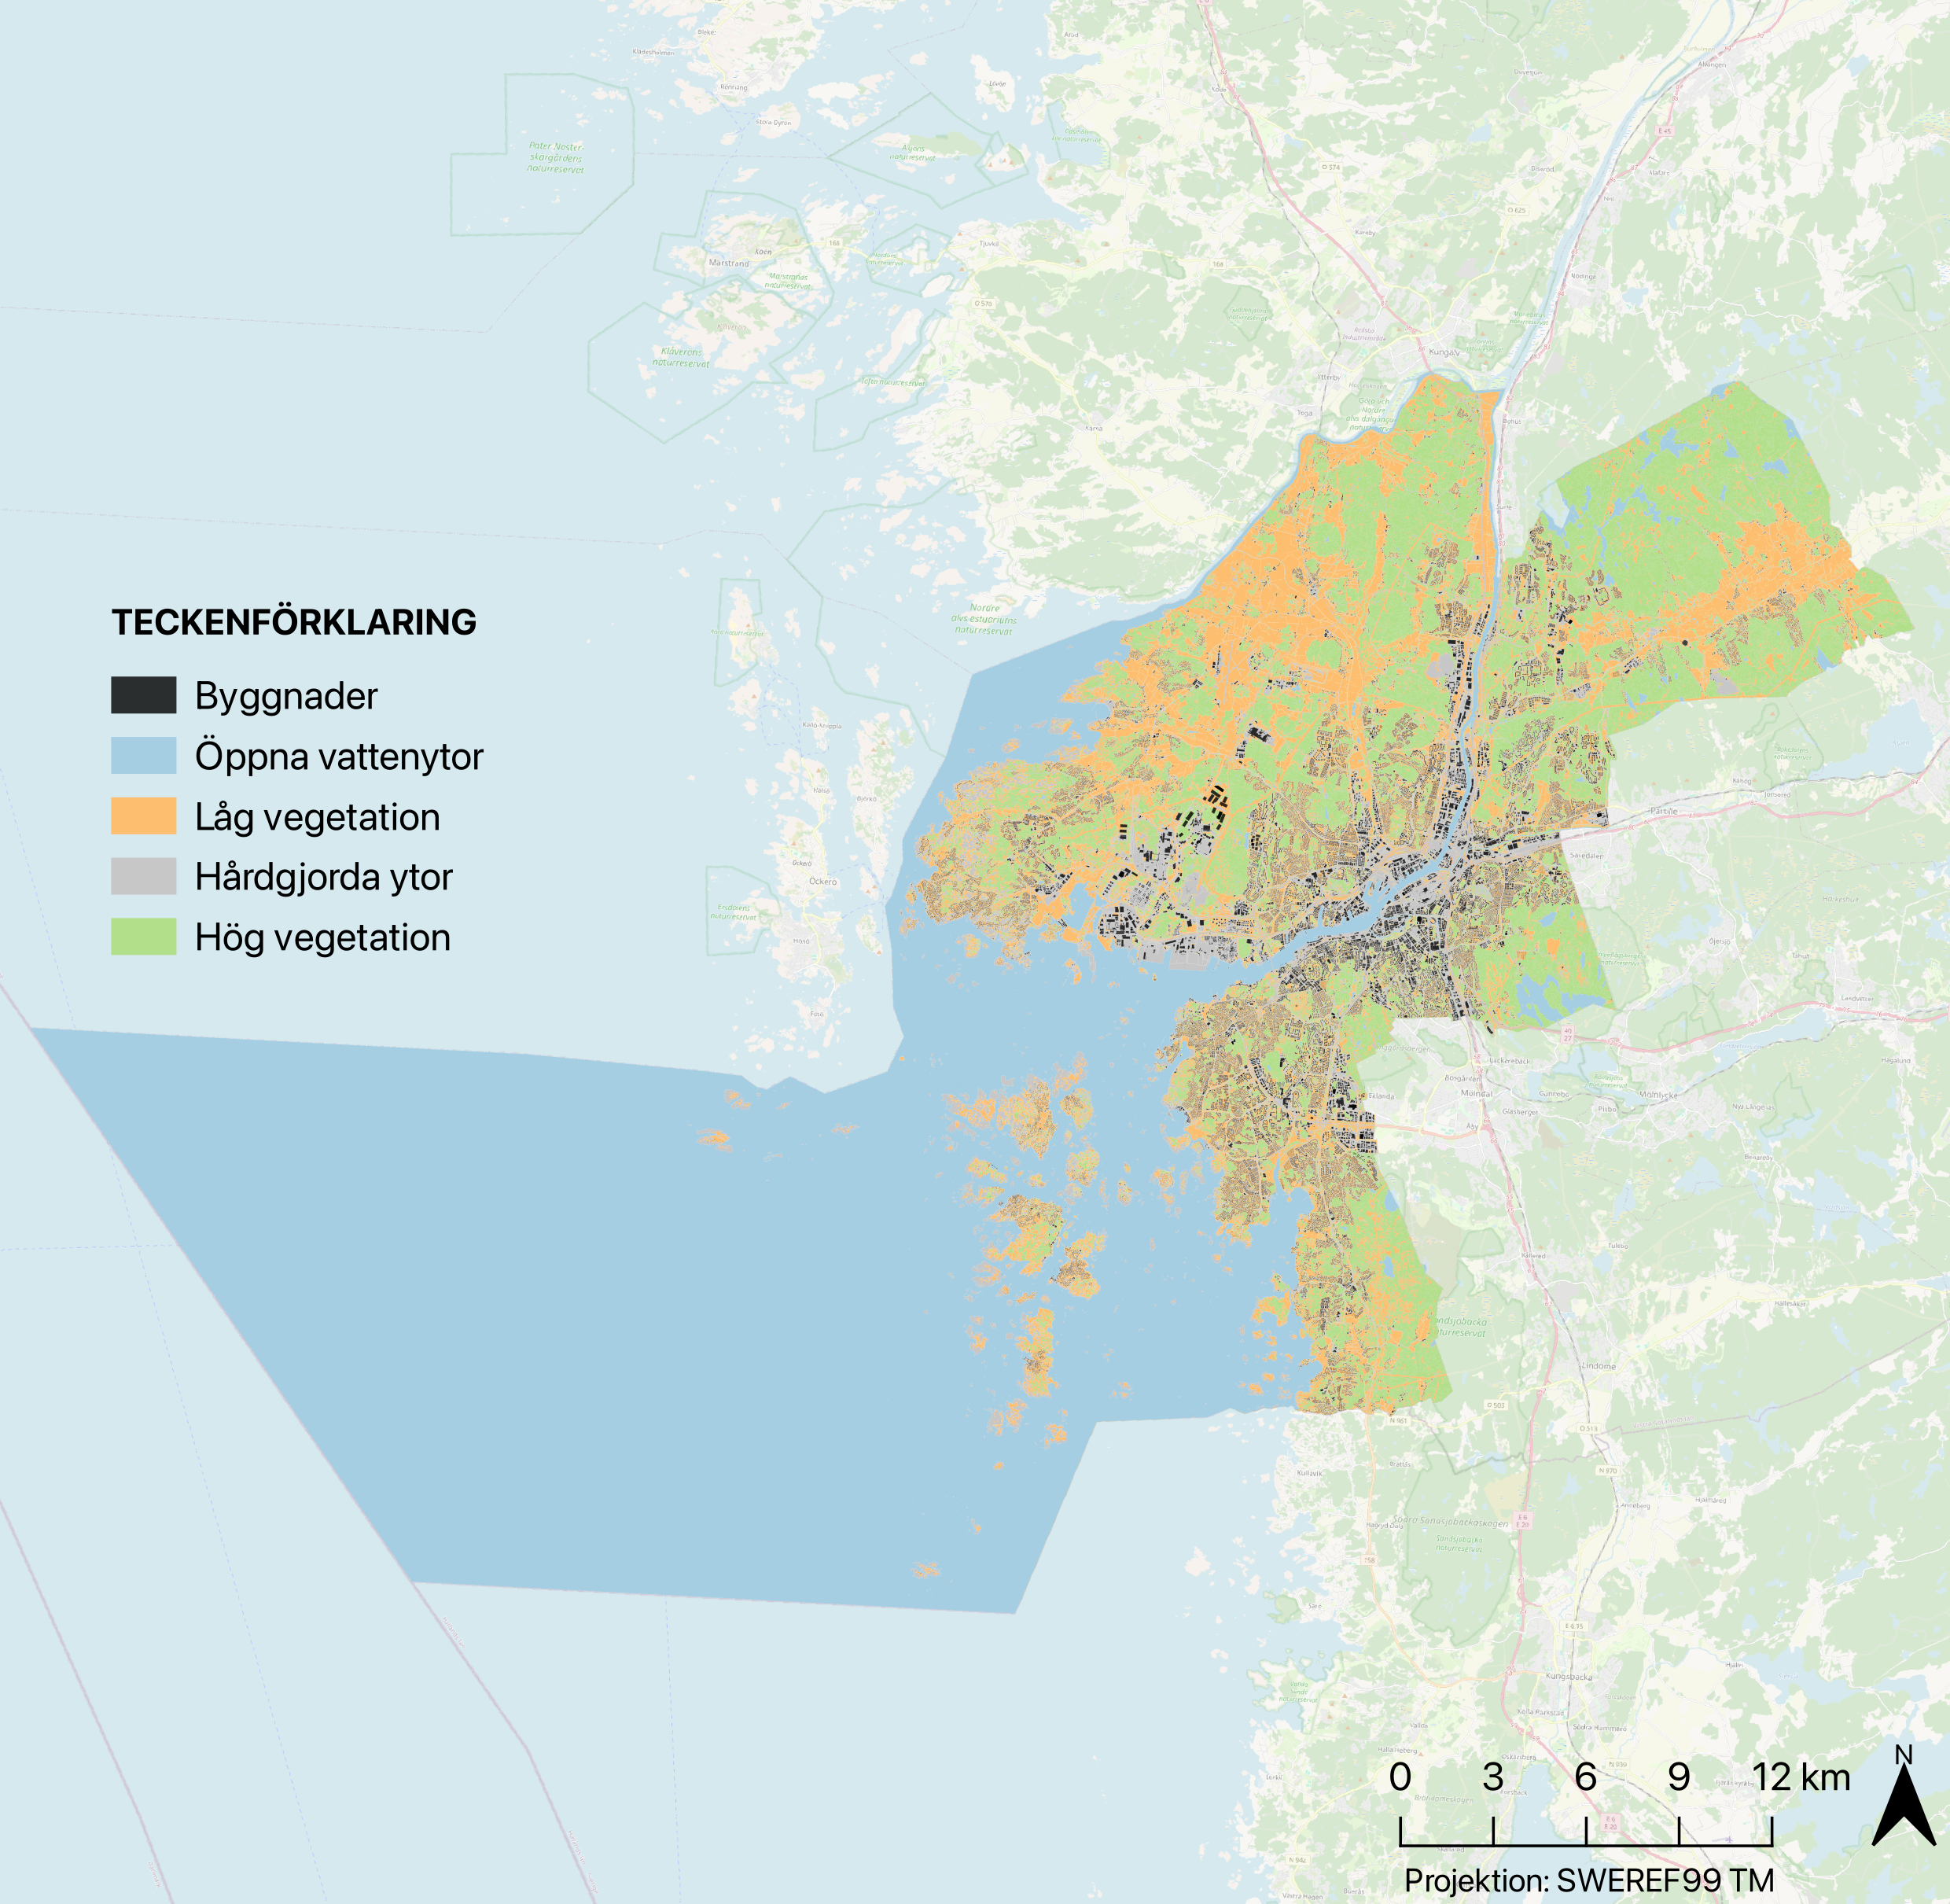 Visualizing landcover data for the administrative area of Gothenburg
Land Surface Temperature (LST)
The LST map was generated using satellite data from Landsat 8, specifically employing the thermal infrared bands (Band 10) combined with the NDVI (Normalized Difference Vegetation Index) derived from Bands 4 and 5. This combination allowed for a precise measurement of surface temperatures across urban and rural areas. The analysis used QGIS and Google Earth Engine to process the data and render the map. The LST values represent the surface heat emitted by different land cover types, with hotter areas typically having less vegetation than concrete surfaces
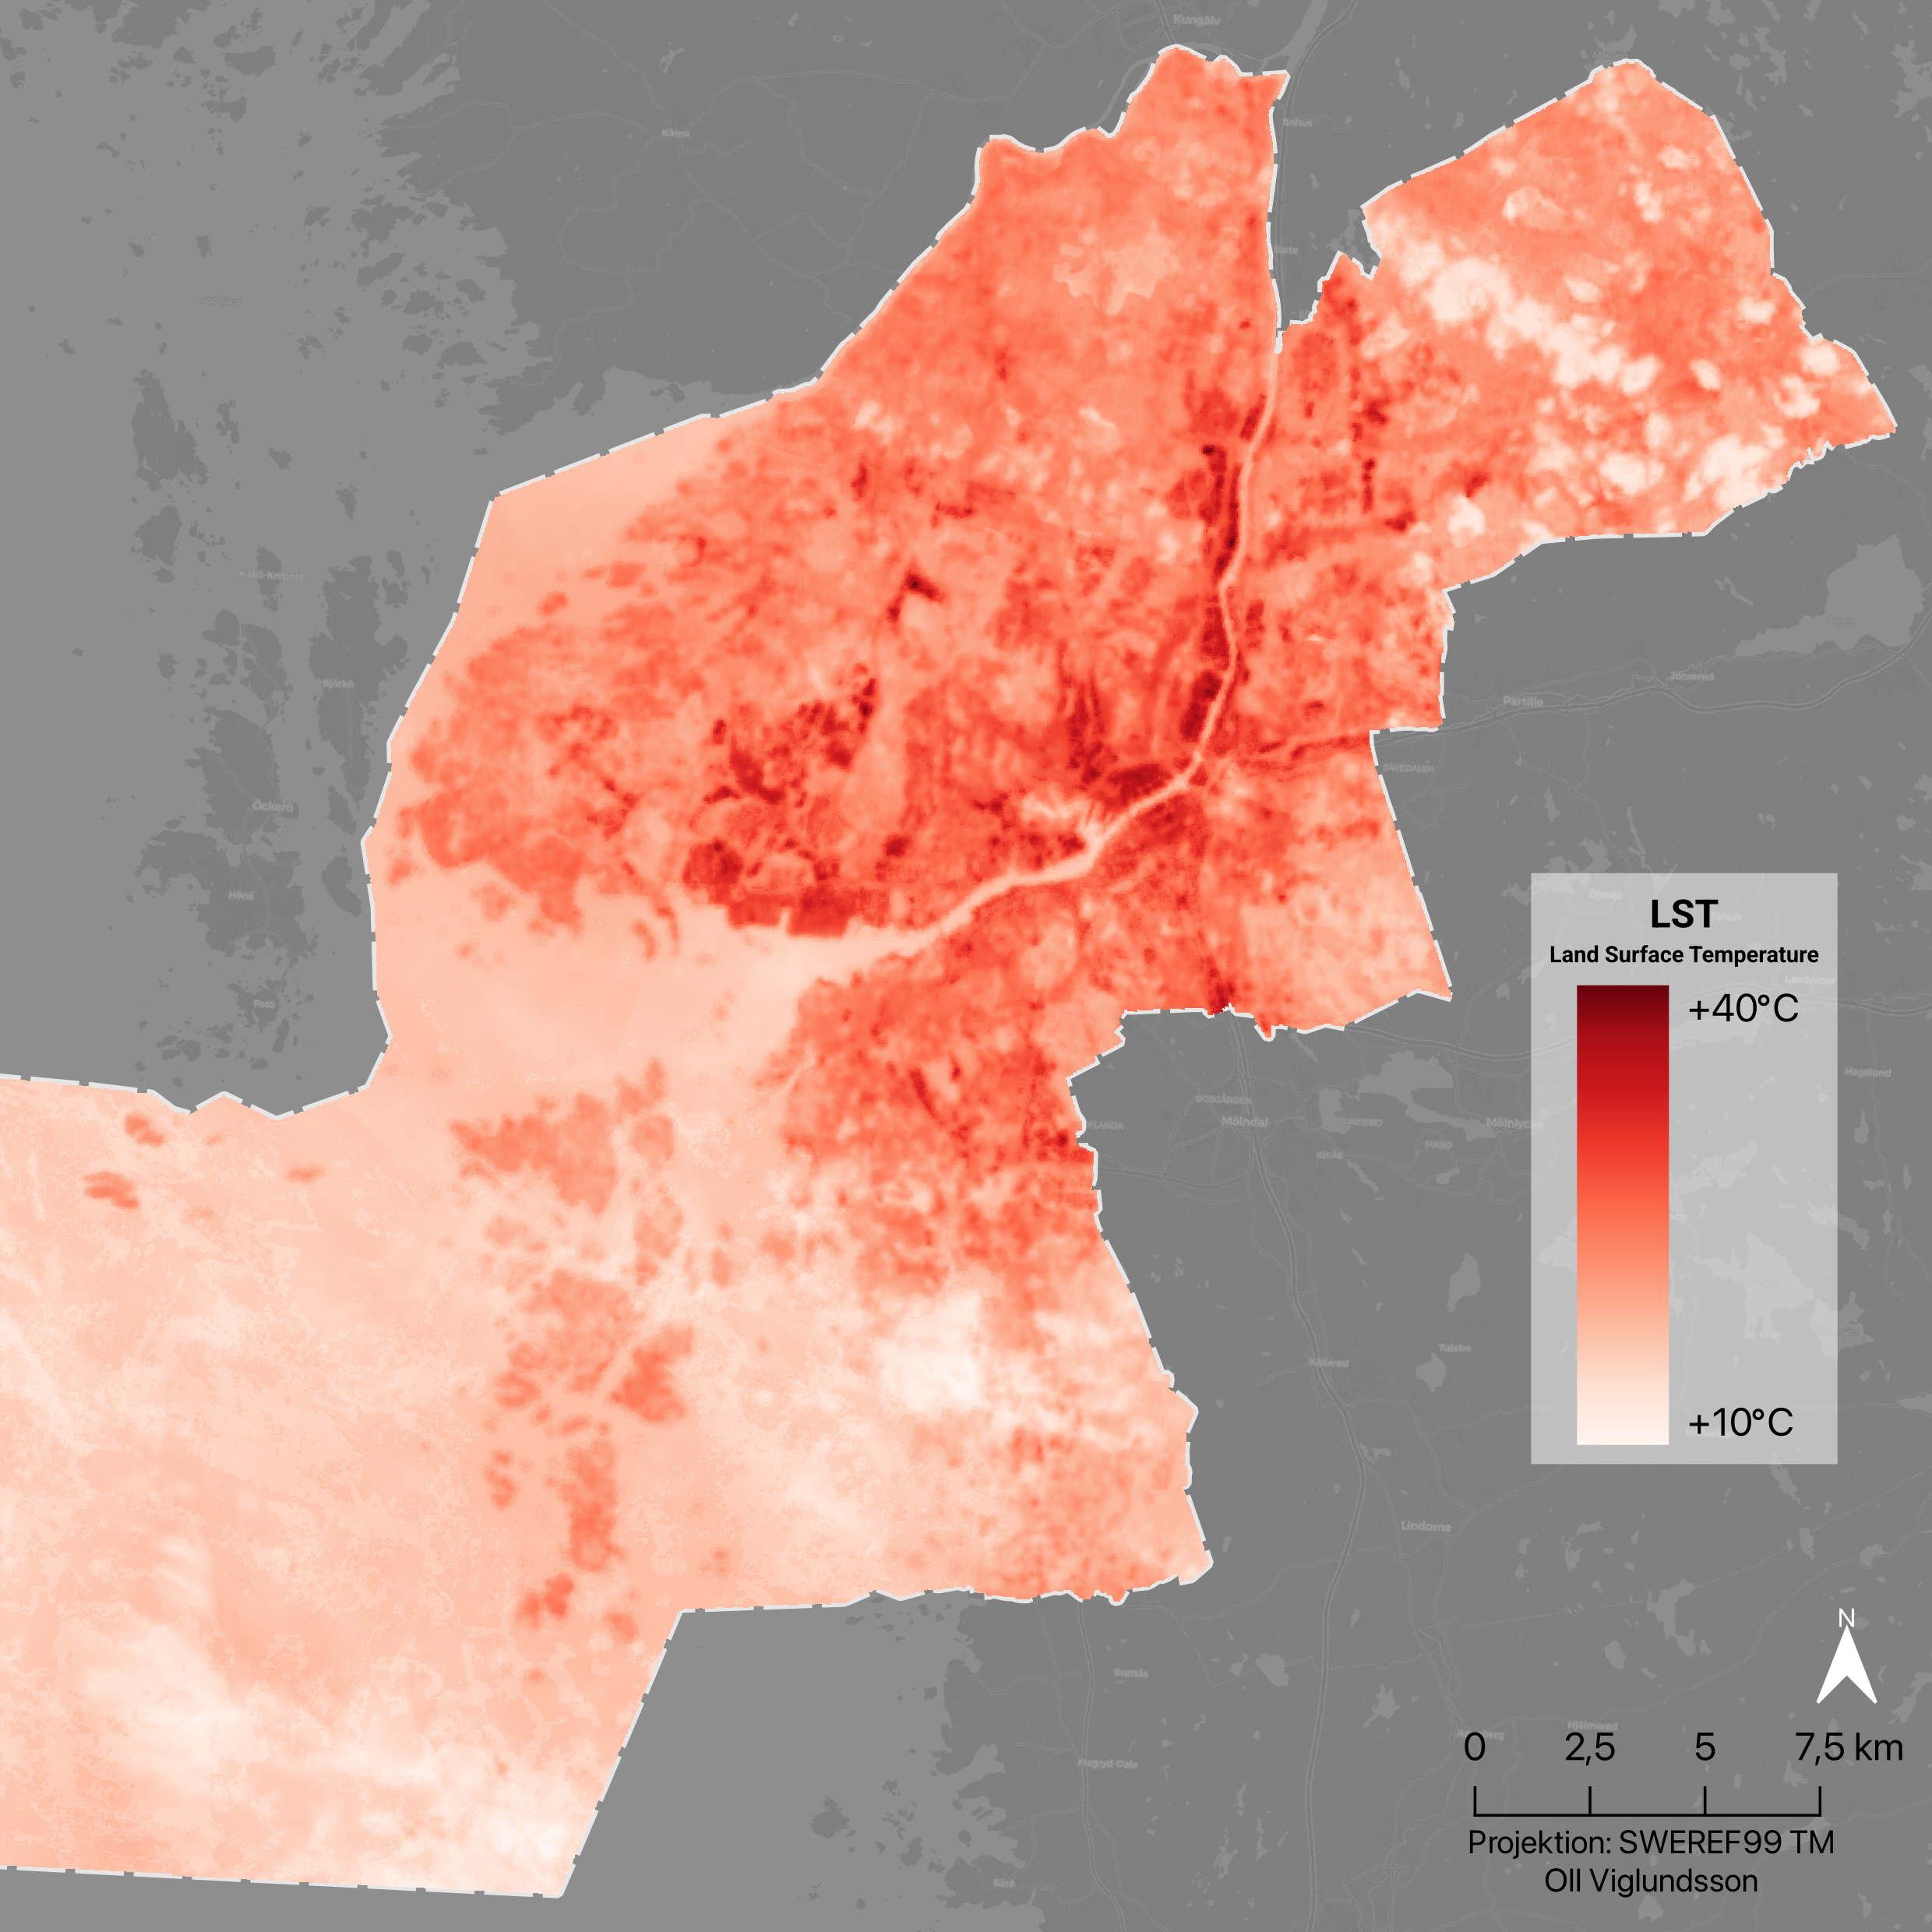 Land Surface Temperature map of Gothenburg showing the highest temperature zones during summer 2024
Urban Heat Island
This UHI map visualizes the relative heat intensity in urban areas of Gothenburg compared to the surrounding rural zones. The UHI effect is calculated by comparing the land surface temperature across regions and emphasizing areas where the temperature exceeds 30°C. The map was derived by filtering out lower temperature zones using the raster calculator tool in QGIS. The analysis highlights dense urban spaces with large amounts of impervious surfaces like asphalt and buildings, where heat tends to accumulate.
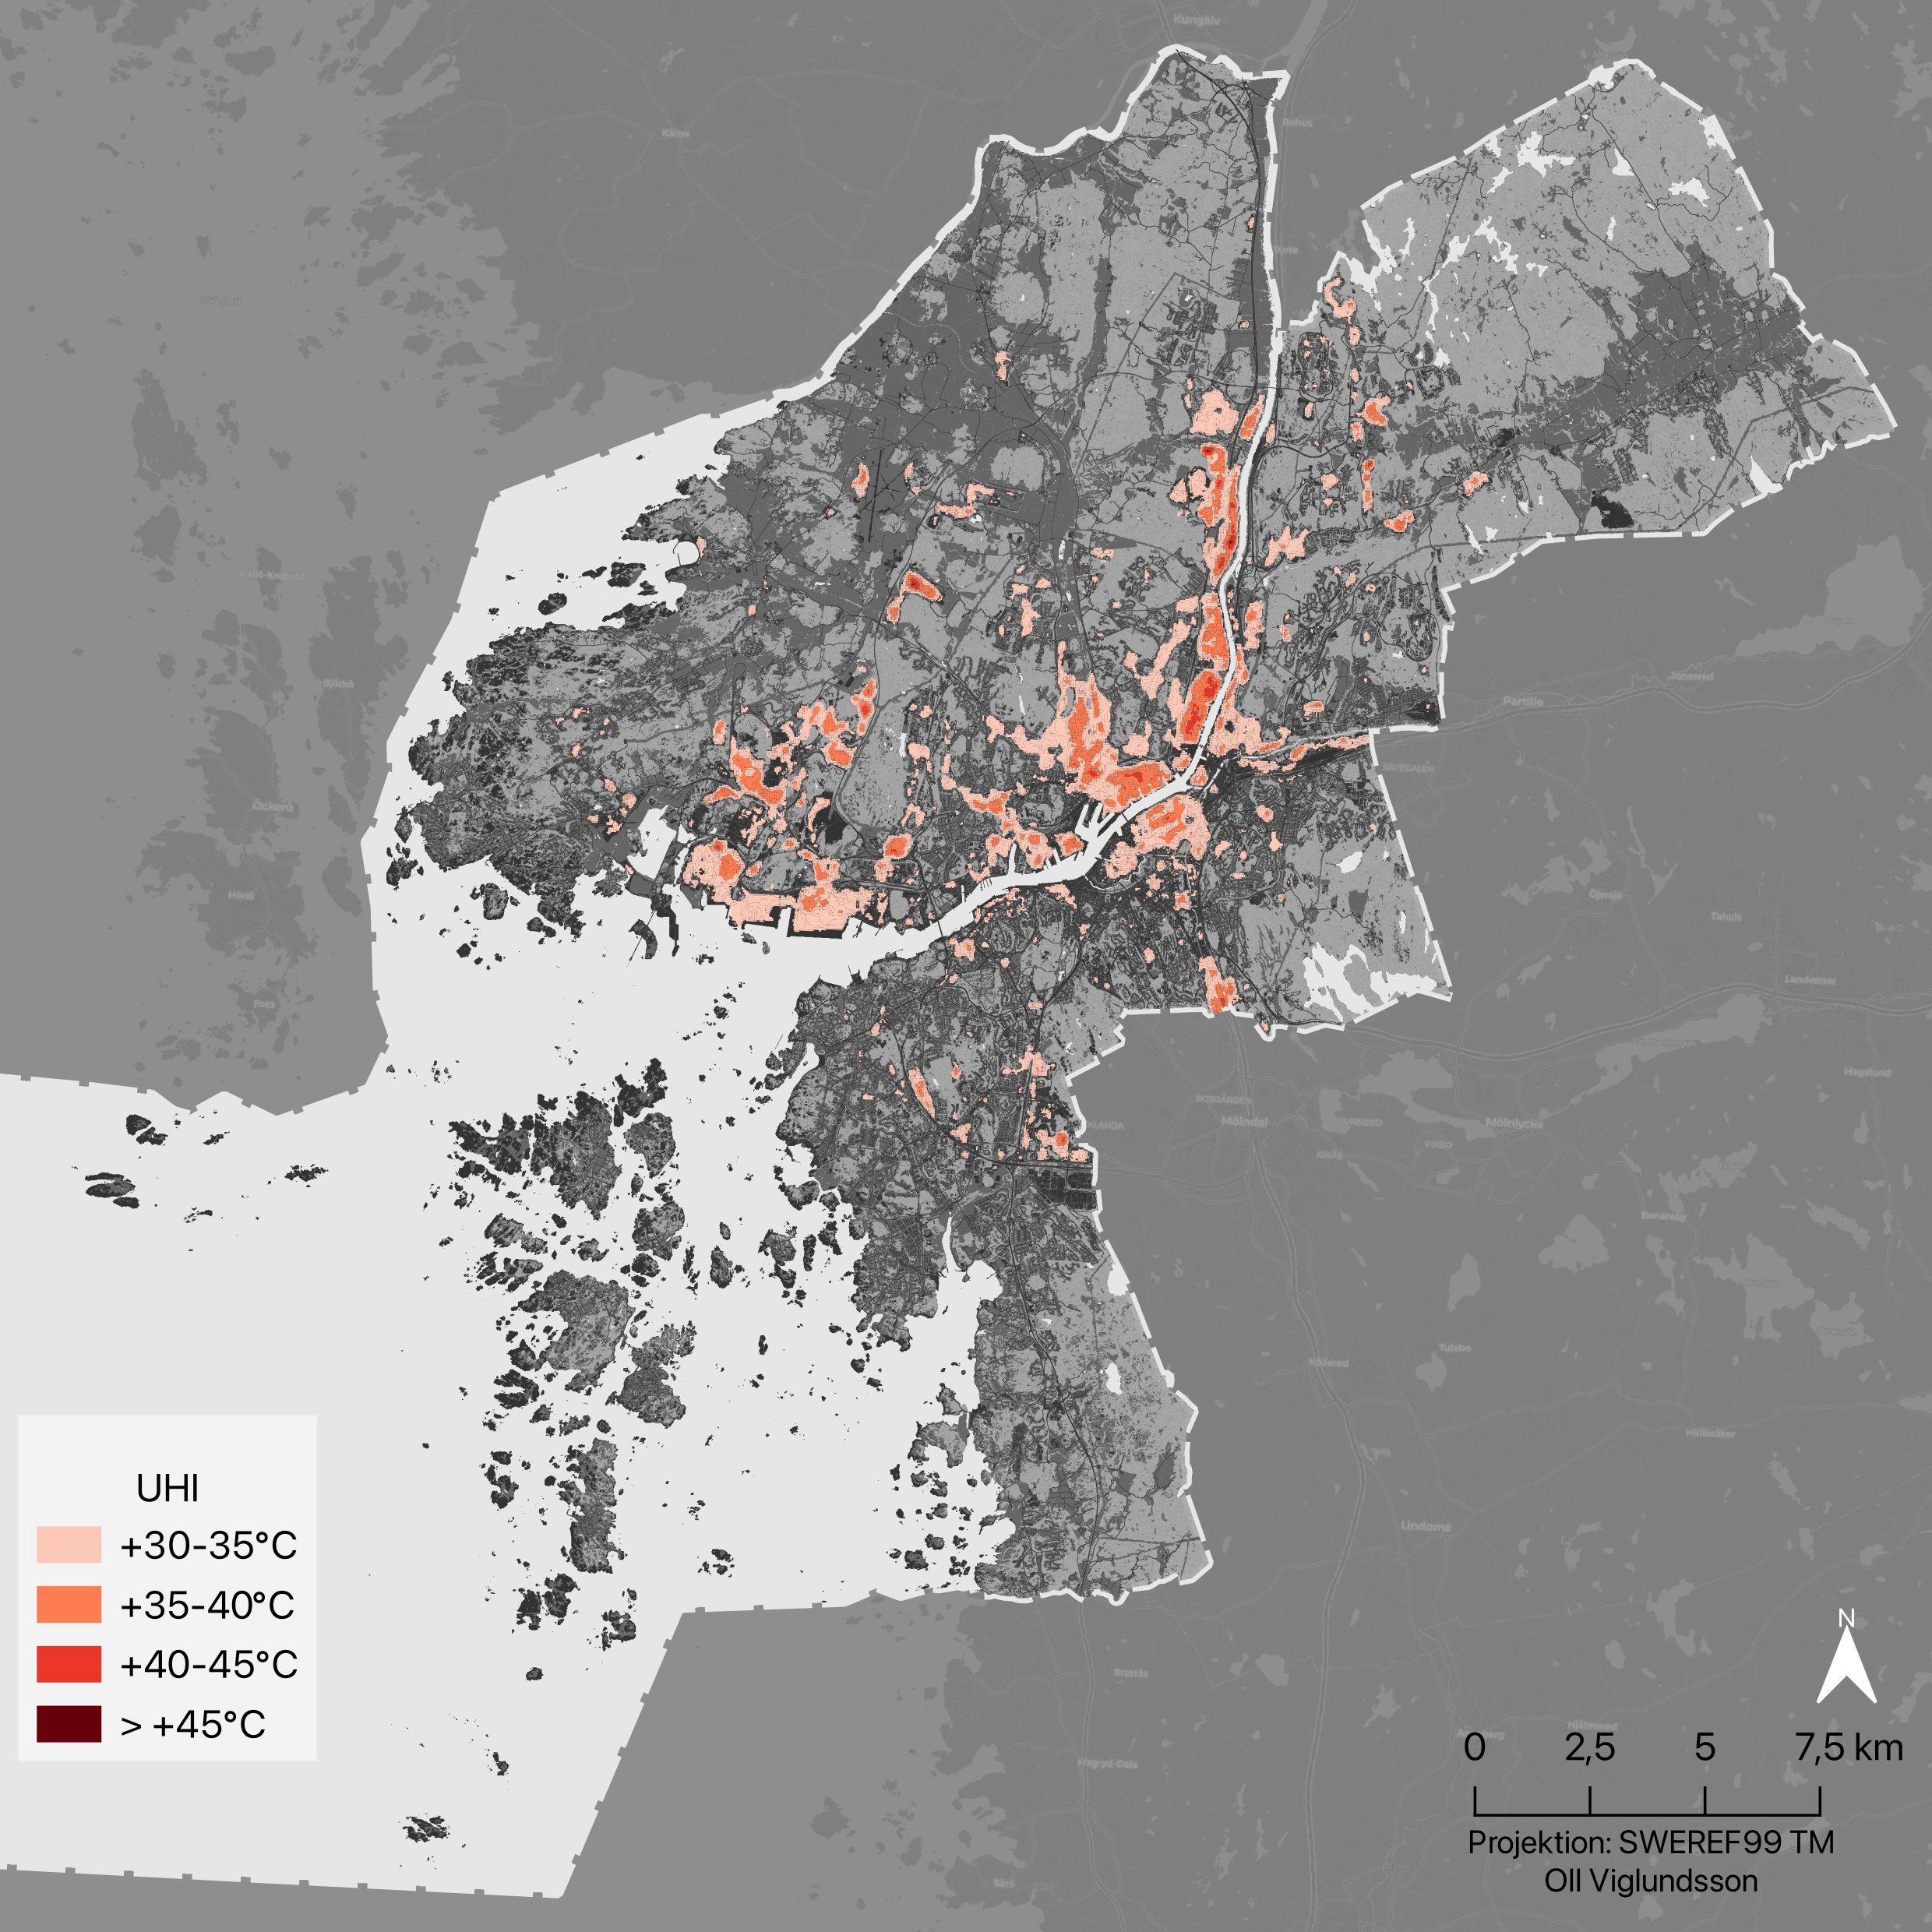 Areas with the strongest Urban Heat Island effect, especially in the central city, reaching over 40°C in some places.
×
![]()
Urban Thermal Field Variance Index (UTFVI)
The UTFVI map quantifies temperature variation within Gothenburg, providing a detailed assessment of heat distribution across different neighborhoods. This index is calculated using satellite data from Landsat 8, combining surface temperature data with vegetation cover. The resulting map categorizes areas into different levels of thermal intensity, allowing for the identification of hotspots with the most severe heat stress. By visualizing thermal variance, this map aids urban planners in targeting areas for climate mitigation efforts like increasing vegetation or altering building materials
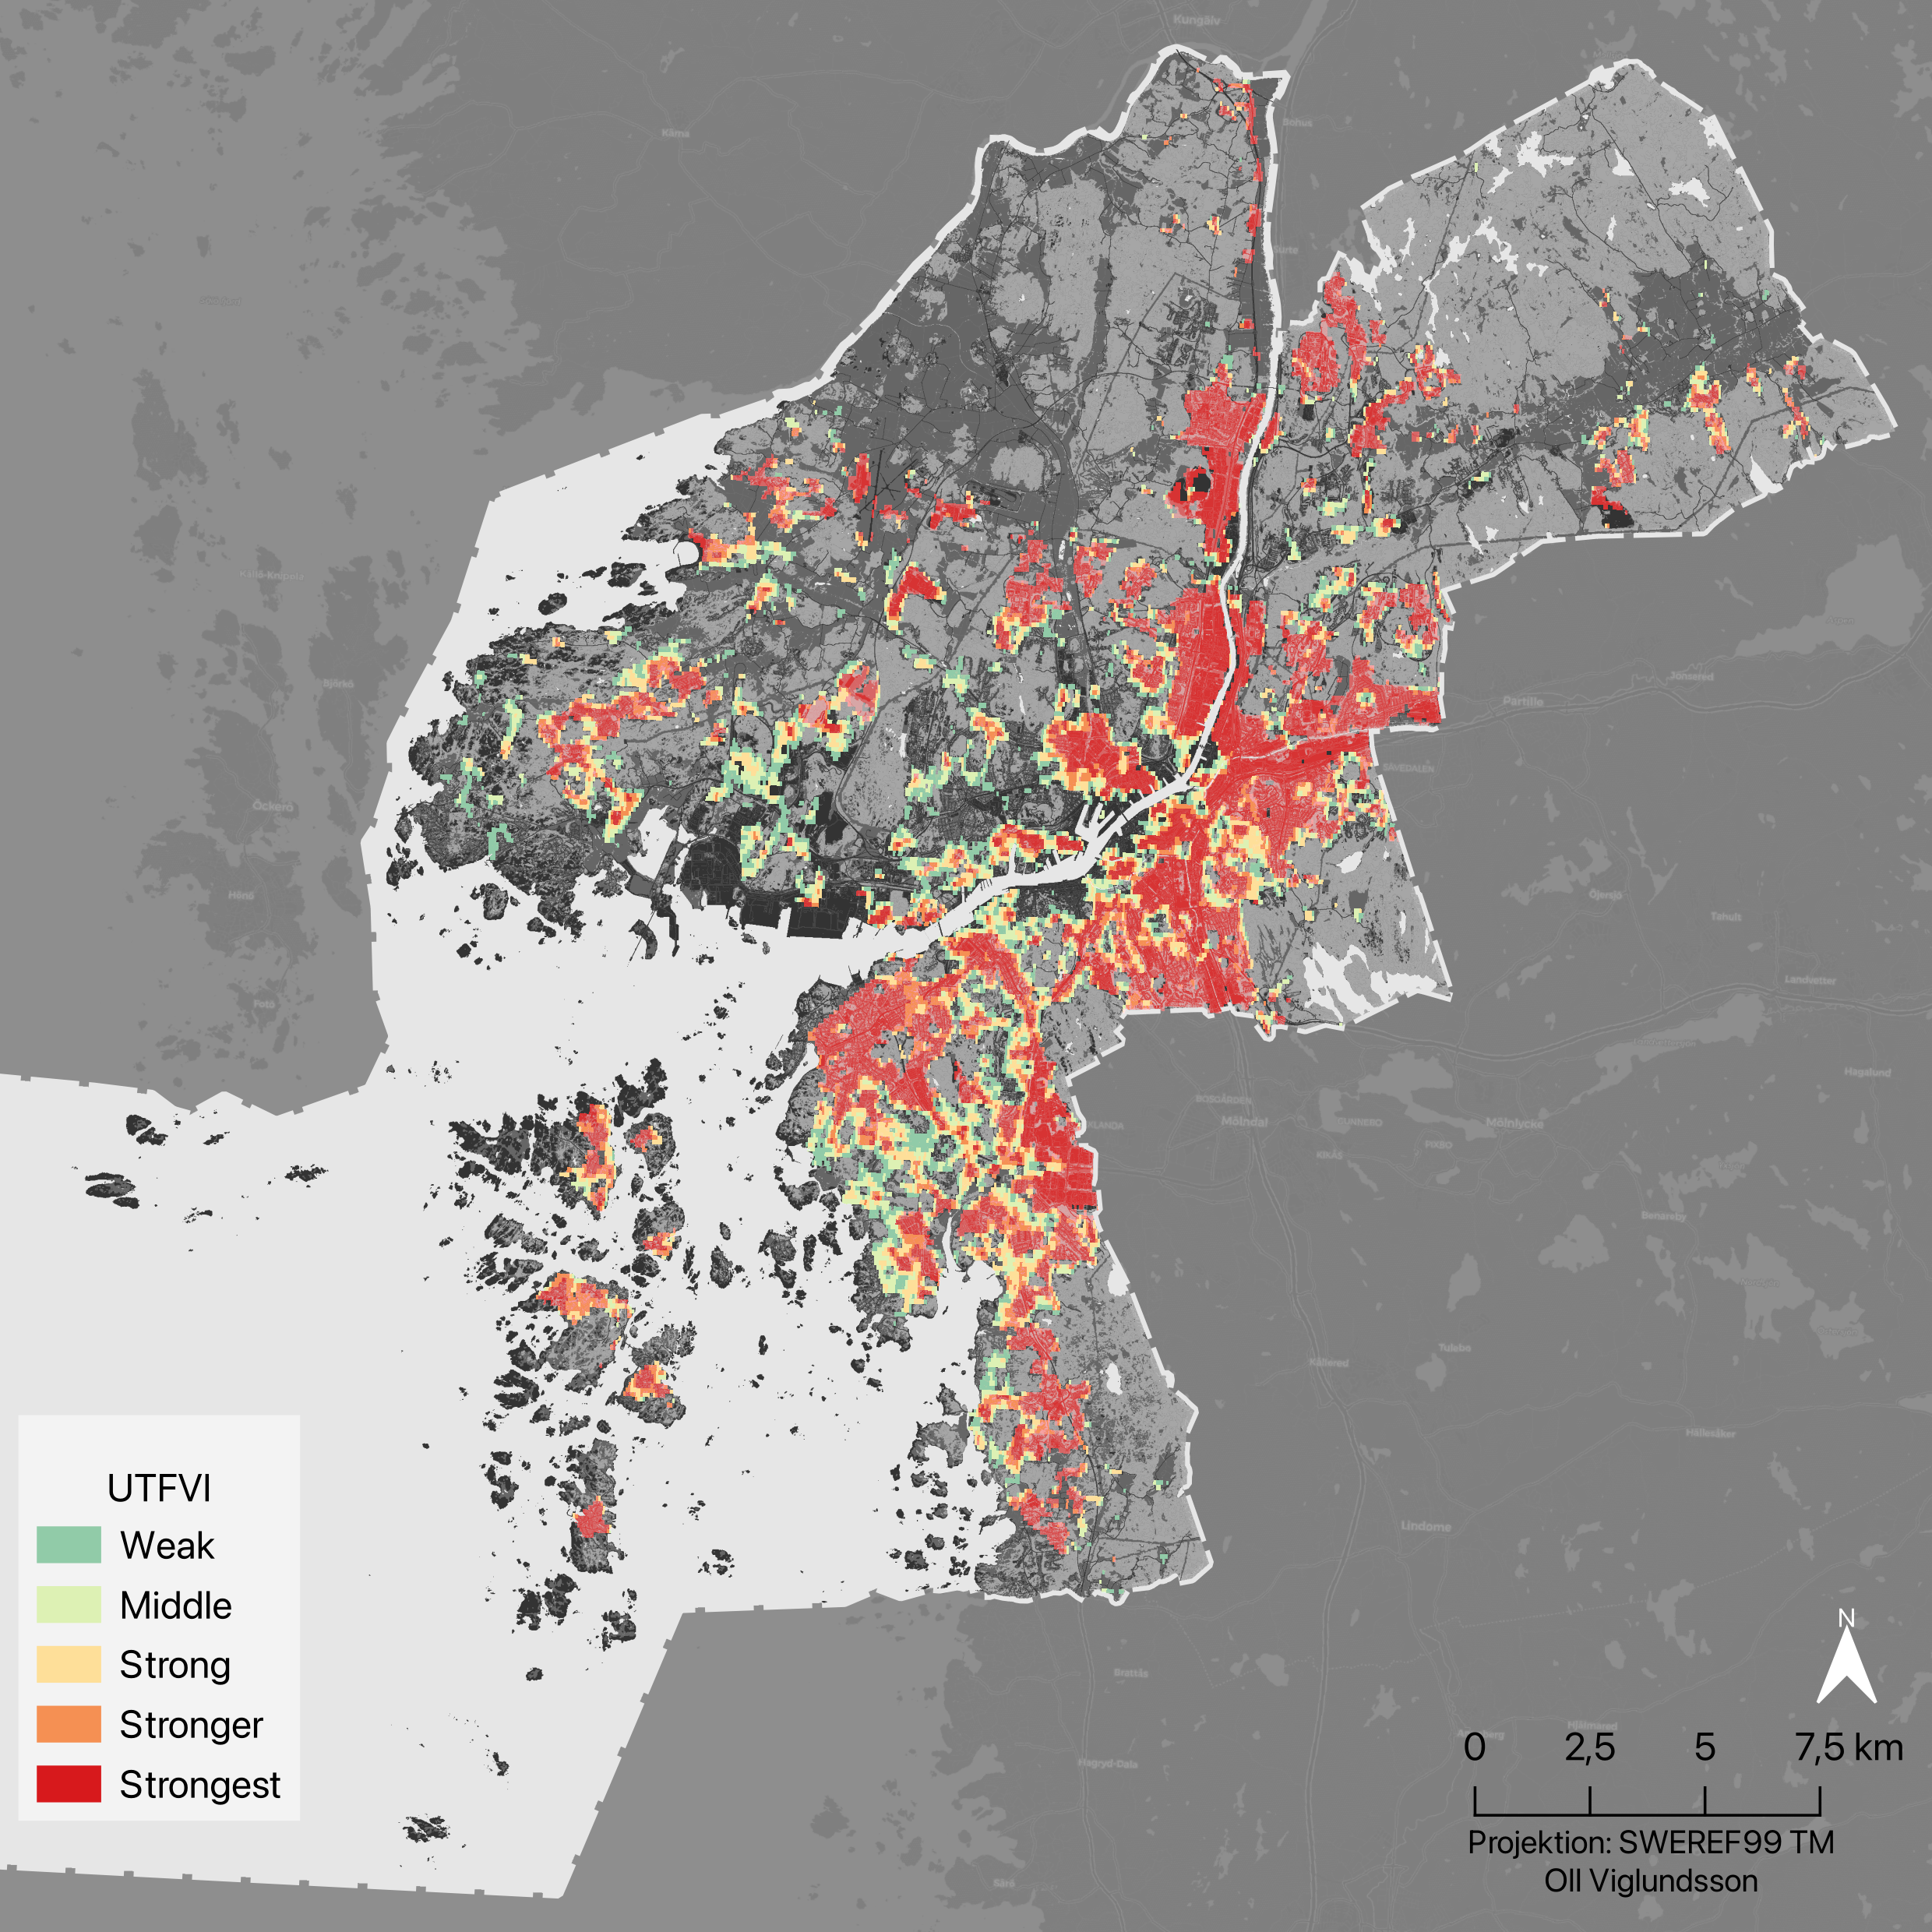 UTFVI (Urban Thermal Field Variance Index) displaying thermal variations over Gothenburg